Tata Technologies Business Analysis
Contents
Business
Industry overview
Operating metrics
Financials
Points to consider
Valuation
Business
Tata Technologies, erstwhile a part of Tata Motors, is leading engineering R&D services company offering product development ,digital solutions to global OEMs ,with deep domain expertise in the automotive industry, also serves clients in adjacent industries, - aerospace and transportation.
They are engaged with 7 out of the top 10 automotive ER&D spenders and 5 out of the 10 prominent new energy ER&D spenders
How it is different from Tata Elxsi?
Tata Elxsi is a specialist ER&D provider focused on software and digital engineering services. TCS is IT services provider, works across 5 verticals.
Tata Technologies is a pure ER&D and digital solutions specialist focussed on automotive domain. More on this in industry overview section.
SERVICES Business (80% of revenues)
1.Product engineering solutions
Tata Technologies works in product engineering solutions including outsourced turnkey EV development, product benchmarking, electric vehicle modular platform for accelerating product development timelines , light weighting framework.
2.EV development capabilities
They have demonstrated EV development capabilities since 2010. Tata Technologies has developed a wide range of differentiated capabilities and offerings for EV projects, including EV architectures, OTA connected services, level 2 and level 3 autonomous driver assistance systems, ADAS, embedded electronics, EV system design, embedded solutions, computer aided engineering, vehicle engineering and integration, prototype build and test and program management.
3.Digital threads
Tata Technologies have built expertise in digital threads- integration across PLM, ERP and MES solutions by developing proprietary integration accelerators. They also have experience deploying Industry 4.0 at scale to transform the manufacturing operations of our clients.
Areas of expertise in Automotive domain
Concept Design
Tear Down and Benchmarking
Vehicle Architecture
Body Engineering
Chassis Engineering
CAE Virtual Validation
ePowertrain
Electrical and Electronics
Embedded Solutions and SDV
Tech Solutions Business (20% of revenues)
1.PRODUCTS Business- PLM APPLICATION SOFTWARE
They resell PLM application software through long-standing partnerships with Siemens Industry Software Inc., Dassault Systemes, and Autodesk.
2. EDUCATION Business- Proprietary e-learning platform
Tata Technologies has proprietary e-learning platform iGetIT to leverage manufacturing domain knowledge to tap into the large upskilling and reskilling engineers and technicians. They impart industry-oriented, job-specific skills for reskilling engineers and technicians. The platform has over 25,000 hands-on exercises and over 2,000 courses across various skill sets, used by enterprise clients, PSUs in India to train engineering, polytechnic and ITI students.
Industry overview
ER&D Industry
Currently, global ER&D spending is estimated at Rs 1,48,67,600cr. Rs 66,49,800cr is digital engineering spending-on new-age technologies like the Internet of Things -IoT, blockchain, 5G, augmented reality, virtual reality, cloud engineering, advanced analytics, embedded engineering and generative AI. Digital engineering spending is expected to grow at 16% for 4 years. Top 100 companies comprise of 48% of total ER&D spends of the industry.
ER&D Services
The global ER&D services is Rs 13,95,600 in 2022, which is 10% of the overall ER&D spend. To avail faster time-to market, shorten product development cycle, save costs- companies are relying on outsourced third party service providers. The ER&D spend outsourced to ESPs stood at Rs 8,62,000 cr in 2022
Automotive ER&D
The global automotive ER&D spend currently stands at Rs14,75,800 cr, making it the largest contributor within the manufacturing sector, constituting roughly 10% of the overall ER&D spend, estimated to grow at 7% CAGR.
Top 20 companies account for 73% of total spends overall spend.
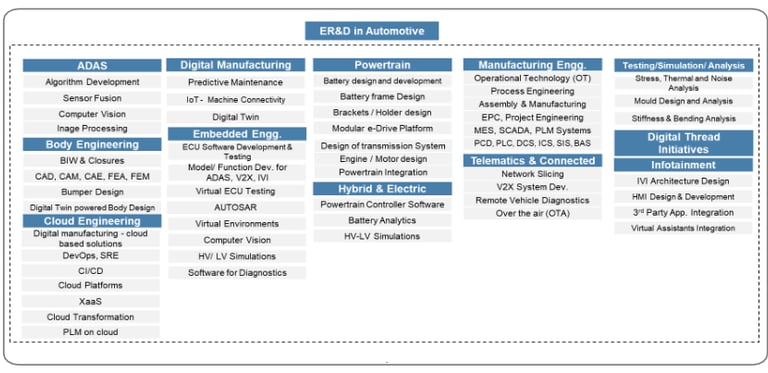
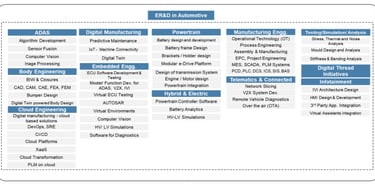
Digital engineering spend in 2022 was Rs 3,77,600 ,expected to grow at 16% CAGR. Digital engineering comprises of ADAS, infotainment, telematics and connected, cloud engineering, digital thread, hybrid and electric technologies, embedded engineering, digital manufacturing etc.
Geography wise contribution Auto ERND ( top spenders)
Europe 49% ( Bosch, MW, Volkswagen)
APAC 38% ( Toyota, Honda, Denso)
N America 13% ( GM, Ford, Tesla)
Majority of market lies in US, Germany, France, China, Japan.
Automotive OUTSOURCED ER&D Spend
The automotive outsourced ER&D market is Rs 1,47,800cr (~ 20% of the overall outsourced ER&D spend) , expected to grow at a faster rate than overall automotive ER&D spending.
Segment wise spends
ADAS & Automotive 12300cr
Hybrid & Electric mobility 24600cr
Infotainment/ connected services 24600cr
Safety systems 8200cr
Traditional powertrain 41000cr
Body engineering 57500cr
Geography wise spends
Europe 75-80%
APC 12-15%
N America 12-15%
Drivers of Auto ER&D Spends
Autonomous- Automotive players are moving towards advanced safety and autonomous driving with environmental sensor technologies- using AI,machine learning.
Connected- OEMs are looking to create connected vehicles that can communicate bidirectionally with other systems outside of the car. The connectivity in a vehicle enables infotainment, safety, roadside assistance, diagnostics efficiency, navigation, and payments.
Electrification- Electric vehicles is top priority for the Automotive industry to meet carbon neutrality goals. Most global OEMs have goals to transform majority of fleet to EVs by 2030-2035, driven by incentivization policies by governments.
Major players
IT Giants like TCS, Infosys, Wipro mainly work in IT /BPM Services, then there are ER&D Specialists like LTTS, Tata Elsi, ta Technologies, KPIT Tech. Tata Technologies and KPIT work in pure auto focussed domains.
Operating metrics
Product Segment wise % of total revenues FY23
Services 80%
Tech Solns. 20%
Total revenues 4410cr.
Out of 80% revenues from services, 71%( of total)is automotive sector.
44% of tech solutions is education revenues( learning modules), 56% from products ( PLM Software)
Geography wise revenues contribution
Europe 23%
India 30%
N America 21%
ROW 26%
Revenues sourcing wise
Onshore 49.6%
Offshore 50.4%
Of the services segment, 36% souring is onshore.
Offshore defined as revenues sourced from outside India/ Romania, but executed / delivered from India/ Romania. A balanced mix of onshore / offshore gives operating leverage and helps win new clients/ maintain client relationships.
Total number of employees 12451 ( 10462 in India) across 19 global delivery centres.
Attrition rate has been reducing from 25% ( FY22) to 21.7% in FY23 and 17% in Sep '23 quarter. ( peers 20-22%)
Manpower utilization 87%
Pricing of contracts time based/material based 40% , fixed 60%
Client concentration
40% of revenues are generated from Tata Motors ( including JLR).
Top 5 clients generate 73% of revenues, indicating significant client concentration risk.
$50million+ 3 nos
$20million+ 3 nos
$10 million+ 6 nos
$5 million+ 7 nos
$1million+ 34nos
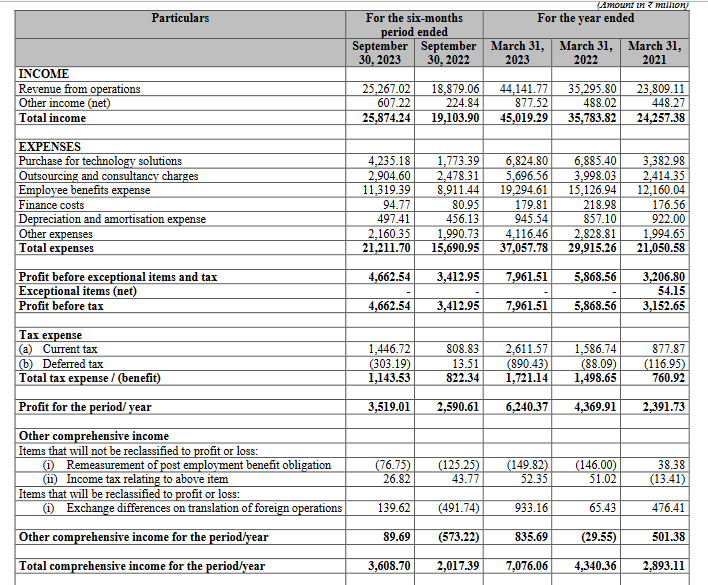
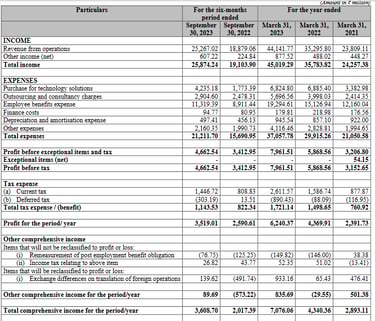
Financials
Annual revenues of Tata Technologies is 4500cr. PAT 620cr.Revenues have become 2x in 2 years and PAT 2.6x ( this has to be seen in light of previous years).
Cashflow from operations 400cr ( poor wrt peers, KPIT/ LTTS CFO > PAT). FY22 was negative cashflow.
Employee costs 43.7% of revenues
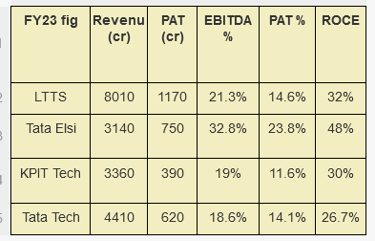
EBITDA margin 20.7%, adjusted EBITDA 18.6%( vs peer KPIT 19%, LTTS 21.3% )
ROCE 26.7% ( KPIT 30%)
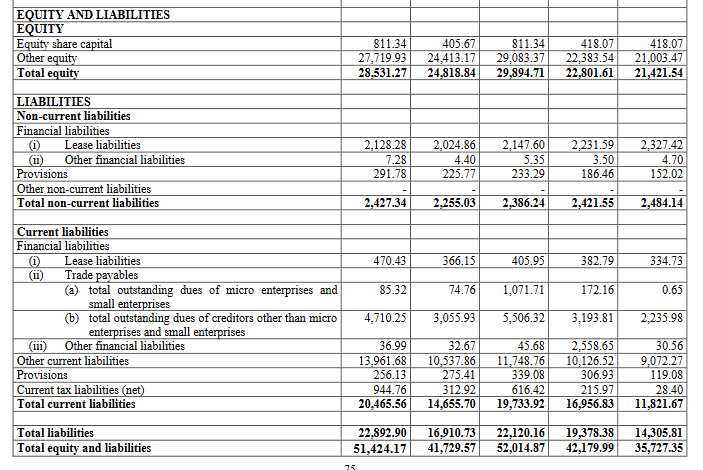
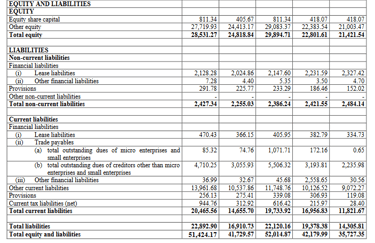
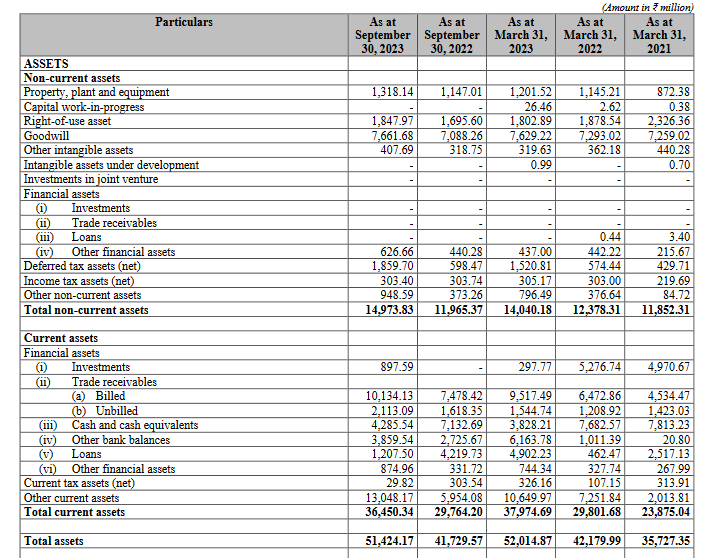
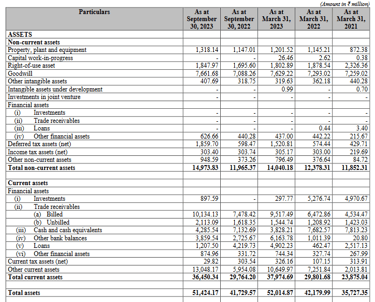
Balance sheet ( figures above in Rs millions)
Debt/ Equity ratio 0.08
Cash 380cr
Receivables 1100cr.( 25% of revenues). Peers 18-20%
Comparable peer KPIT Tech ( automotive domain), other peers LTTS, Tata Elsi operates in 4-5 domains
Points to consider
Despite challenges in US, EU, automotive R&D upgrade being need of the hour for auto OEMs, ER&D spends unlikely to be postponed by companies, given the timelines of carbon neutrality achievement and EV competition from Tesla.
Automotive ER&D industry is in sweet spot for coming times, and along with KPIT Tech, Tata Technologies is favourably placed to benefit from the tailwinds. Separate listing may help it scale newer heights.
Continuous supply of large number of low cost engineering talent is the main moat of of Indian ER&D companies. Considering the attrition of 20% , fresh supply pipeline of 2500 graduates is in place thanks to Education course business and tie-ups with colleges.
Very high client concentration, given 40% of revenues from Tata Motors/JLR, growth significantly dependent on orders of Tata. Top 5 clients giving 73% of revenues is way too high.
Receivables 25% of revenues (higher than peers) and cashflow from operations < PAT ( where peers> 100% of PAT) is something to be noted, FY22 was negative cashflow, though business being B2B, cashflows are bound to be lumpy.
26% of revenues depend on new energy startups.
Margins dependent on forex fluctuations.
26% of revenues depend on new energy startups.
Valuation
Tata Technologies valued at P/E 32.7 whereas comparable auto peer KPIT Tech valued at P/E 86 ,others LTTS 37 and Tata Elxsi at 66.
To conclude, while KPIT addresses R&D of software part, embedded systems of automobiles, Tata Tech addresses entire value chain of automotive R&D (product development)- hardware (mechanical parts), software both
That's the basic difference . So they are not exactly comparable.
Follow us on twitter
You may be interested in
PB Fintech Business Analysis
Will Jio Financial disrupt Bajaj Finance
Paytm Business Analysis
#themoatinvestor #dmoatinvestor #tatatechnologiesipo #listinggain