Sai Silks Business Analysis
Contents
Business
Industry overview
Operating metrics
Financials
Points to consider
Valuation
Business
Sai Silks, started in 2005, by current MD Nagakanaka Durga Prasad Chalavadi based out of Hyderabad , is among top 10 Women Indian wear retail chain in South India. Products of Sai Silks cater to various segments of the market that include premium ethnic fashion, ethnic fashion for middle income and value-fashion, with main focus on Sarees. Sai operates through store network of 54 stores spread across 4 southern states- Andhra Pradesh, Telangana, Karnataka and Tamil Nadu. They follow a cluster based approach to expansion. Stores are owned and operated by company properties under lease agreements.
Product segments
1. Ultra-premium and premium sarees suitable for weddings, party wear, daily wear
2. Lehengas
3. Men’s ethnic wear
4. Children’s ethnic wear
5. Fusion wear and western wear for women, men and children.
Sai Silks operate through 4 store formats. Average store size given in brackets.
Kalamandir (10,390 sqft)
VaraMahalakshmi Silks (6,099 sqft)
Mandir (3,310 sqft)
KLM Fashion Mall (18,400 sqft)
Total area of stores is 603,414 square feet. Products are procured from 4,832 master weavers, weavers and vendors. Until FY22, products were procured from Sai Retail, a company related to promoter group. Now Sai Retail has been acquired by Sail Silks.
Sai Silks has a market share of 10% in organized saree in South India.
Main competitors are Nalli, Pothys, The Chennai Silk, Kankatala, Rangoli, Neerus and VRK Retail.
Industry overview
The Indian apparel market size Rs 5,47,600cr in FY22, expected to grow at 21% CAGR. 62% of the apparel industry is unorganized, 38% organized, out of which 18% organized Brick & mortal stores, 20% e-commerce.
Apparel market categorized as
Men's 41%
Women 37%
Kids 22%
In women wear, Indian wear contributes 67% , western wear 33%.
Women Indian wear market is 1,34,500cr. Saree market size is 52300cr.
Geography wise organized market of Saree as follows
South 50%
East 19%
West 16%
North 15%
Organized Saree market in South is 11,300cr, expected to grow at CAGR of 28%.
Key competitors in South are Pothys, RS Brothers, Kalyan Silks. Sai Silks has a market share of 10% in south Saree market, Pothys has also 10% market share.
Bigger retailers like Pantaloons, Reliance Retail, Fab India, Biba, Soch- all are mainly targeting the SKD ( Salwar Kameez Dupatta) segment of Indian wear and western wear category.
Points to consider
Saree market in south is largest- 50% of organized saree market of India is in South. Being among the largest players alongside Pothys with 10% market share, and increasing store count from 54 to 84 in next 3 years will help Sai Silks to sustain this leadership.
Threat from national apparel retail chains is not there as they focus on western wear and SKD segment of Indian wear, as saree retail is higher inventory business, keeping huge SKUs at that scale they operate may not be efficient capital allocation for them.
Saree business is inventory heavy , though fund raised in IPO should suffice for next 2 years requirements including additional stores opened.
Promoter group has pledged shares equivalent to 17% of total equity.
Currently, online sales ( started post-covid) through website of Sai Silks is 1.3% of revenues. If they can focus on that combined with customer retention tools like loyalty program ( which they intend to start) - can help them improve customer engagement, repeat purchases.
Valuation
Sai Silks is valued at P/E of 35, whereas Trent trades at 110-150, Shoppers Stop 70, Aditya Birla Fashions is loss making.
You may be interested in
Yatra Online IPO Analysis
How to do IPO analysis for listing gain
How to avoid companies like Brightcom/ BCG ? Investing red flags
Will Jio Financial disrupt Bajaj Finance
Follow us on twitter
#themoatinvestor #dmoatinvestor #saisilksipo #listinggain
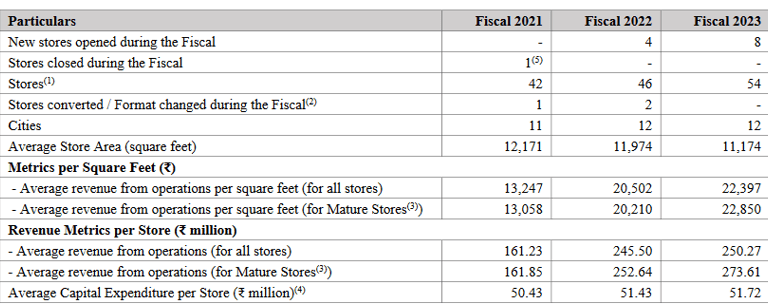
Operating metrics
Average revenue / sqft is Rs 22400. Average revenues/ store is Rs 25cr.
Segment wise revenues (Total revenues 1350cr)
Sarees 68%
Others 32%
Revenue contribution state wise / number of stores
Telengana 45% / 25
Andhra 33% / 16
Karnataka 13% /9
Tamilnadu 9% / 4
30 new stores that will come up in next 3 years will be in Tamil Nadu.
Average invoice value store format wise
Kalamandir Rs 5020 (5 new stores upcoming in 3 years)
Varalakshmi Rs 12350 (25 new stores upcoming in 3 years)
Mandir Rs 24000
KLM Mall Rs 2570
Financials
Annual revenues of Sai Silks is 1350cr. PAT 97cr.
4 year revenue CAGR since FY 19 is 6.6% and PAT CAGR is 34%, indicating improved operating efficiency levels wrt pre-covid.
Gross margins are 39% ( Trent 42.7%, Aditya Birla Fashions 55%)
EBITDA margins 15.7%
PAT margins 7.2%
ROCE at 23.5%


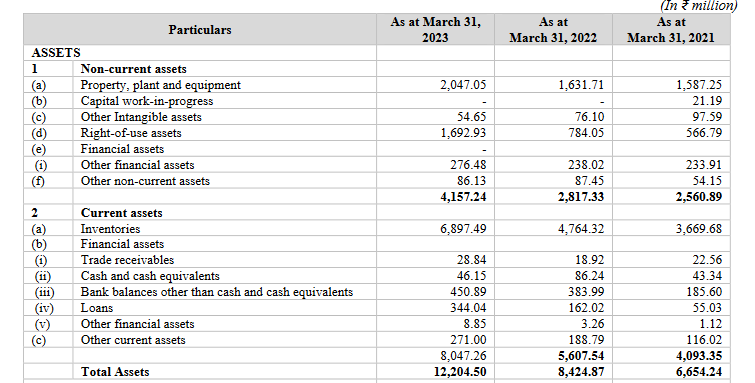
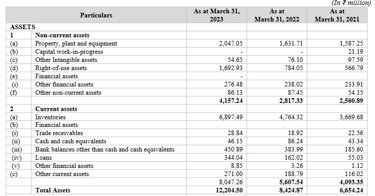
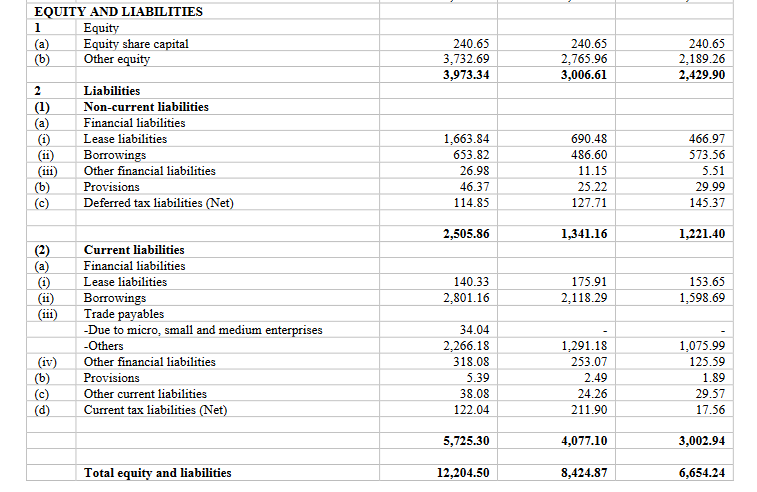
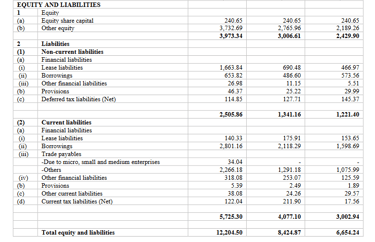
Balance sheet ( amount above in Rs millions)
Borrowing at 345cr
Current debt/ equity ratio at 0.87
Trade receivables negligible.
Payables high 260cr.
Cash equivalent of 4.6 cr.
Cashflow from operations positive 41cr.
Inventory days quite high 157 days ( Aditya Birla 105, Shoppers stop 115).
Average inventory is 580cr ( inventory turns 2.3), bigger peers Aditya Birla 3.5, Shoppers stop 3.2

