JSW Infra Business Analysis
Moat
52% of business comes from captive customer base of related party of JSW group companies like JSW Energy & JSW Steel. 64% of revenues is from repeat customers. Having such a huge steady captive customer base is a very strong moat of JSW Infra. Contracts with JSW group customers are mostly long term type, with some take-or-pay provisional contracts. Though peers Adani Ports and GPPL have similar captive customer base.
Long term leases of operating ports is another moat. JSW Infra has average 25 years of lease agreement time remaining for ports it operates.
Ports are located strategically near to the related parties, leading to operational and cost efficiency.
All these along with significant capital involvement makes entry barriers high.
Points to consider
JSW Steel is expected to achieve 37 MTPA in FY25 from 27.7 MTPA in FY23, and JSW Energy expected to achieve 10 GW in FY25 from 4.8 GW in FY23. So naturally, this will lead to substantial cargo handling volumes growth of JSW Infra.
JSW Infra has metrics similar to Adani, and growth of last 2 years is very high. Long term contracts with JSW group companies coupled with steady demand of key commodities handled like coal, crude oil products, iron ore along with congestion in major ports gives steady long term revenue visibility for JSW Infra.
40% of revenues come from JSW Steel- very high customer concentration, which may affect the business of JSW Infra in case JSW Steel business suffers.
Port operations are subject to environmental clearances and scrutiny of National Green Tribunal. Operations may get hampered if it comes under violations of ESG clearances. In fact, one of the port terminals is facing a litigation from National Green Tribunal regarding its expansion.
5 port terminal subsidiaries ' ( JSW Infra operates each port terminals under different subsidiaries) shares are 70-100% pledged by promoter
Valuation
JSW Infra is valued at P/E of 33.5, whereas comparable peers Adani Ports currently trades at 24, GPPL at 17
You may be interested in
Manoj Vaibhav Gems IPO Analysis
Will Jio Financial disrupt Bajaj Finance
How to do IPO analysis for listing gain
How to avoid companies like Brightcom/ BCG ? Investing red flags
Follow us on twitter
#themoatinvestor #dmoatinvestor #jswinfraipo #listinggain
Operating metrics
Capacity utilization at 57% ( similar to India average 56%). Cargo volume handled- India is 93 MMT in FY 23.
Revenue mix
JSW Group 52%
Third party 33%
Vessel related charges 15%
64% revenues from repeat customers.
JSW Group companies are mainly JSW Steel and JSW energy.
Revenue mix- Cargo handled (Total revenues 3190cr)
Thermal coal 27%
Iron ore 30%
Other than thermal coal 25%
Container 2%
Liquid & gas cargo 0.5%
Others 10%
Total India cargo 94.5%
Channel mix- cargo handled
Rail traffic 37%
Road traffic 21%
Waterway 29%
Conveyor 28%
Port terminal wise traffic handled
Jaigarh terminal 41%
Dharamtar 14.8%
Paradip iron ore terminal 10%
Paradip coal terminal 8%
Ennore coal terminal 8.3%
South west terminal 8.8%
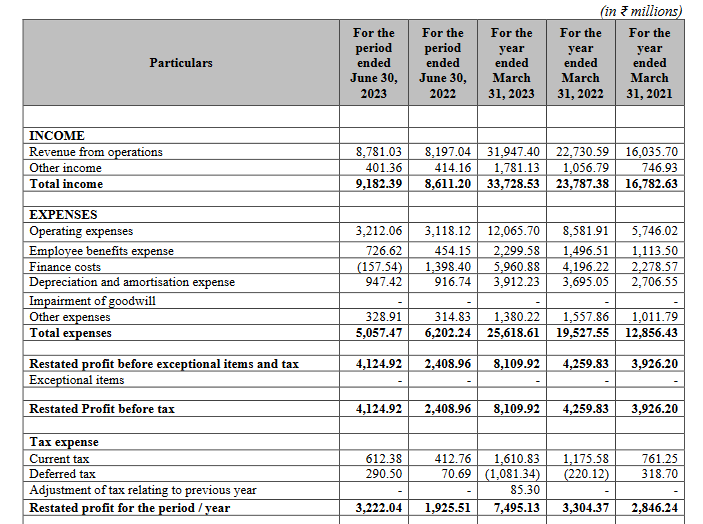
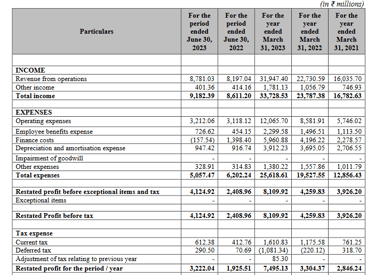
Financials
Annual revenues of JSW Infra is 3190cr. PAT 750cr.
Revenues became 2X in last 2 years, PAT 2.6X in 2 years.
PAT margins have improved from 17% to 23% in last 2 years.
Operating margins 51% ( similar to GPPL, Adani 57%)
PAT margins 23% ( Adani 26-29%)
ROCE at 9.5% ( Adani 9.5%)
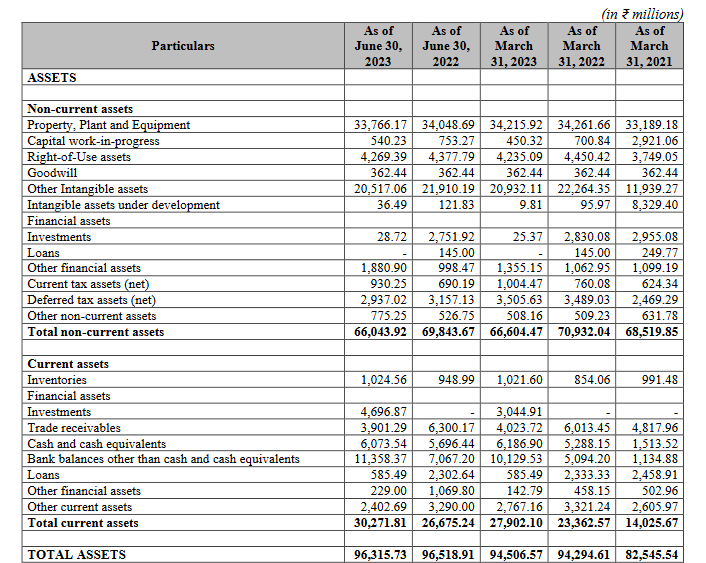
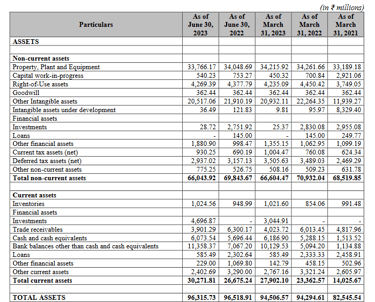
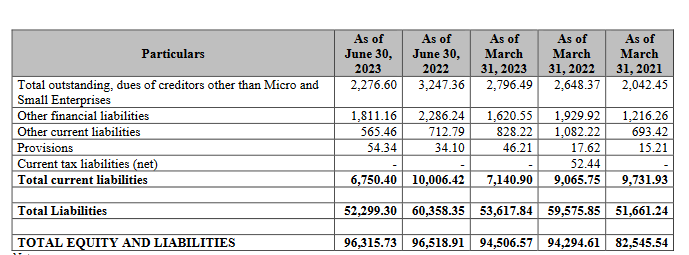
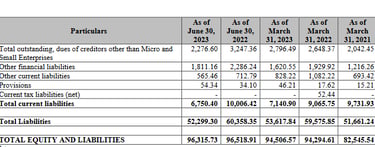
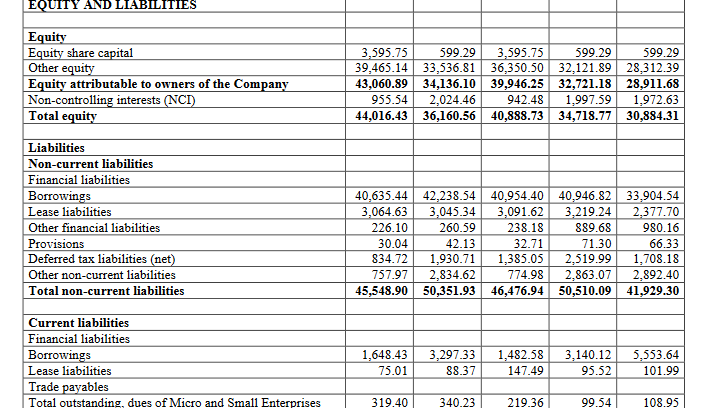
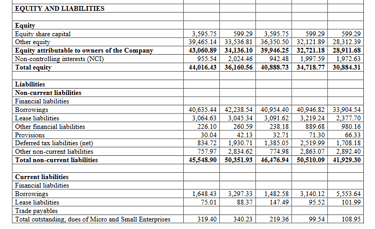
Balance sheet ( amount above in Rs millions)
Borrowing at 4570cr
Debt/ equity ratio at 1.12 ( Adani 1.16)
Interest coverage ratio 2.9 times ( Adani 2.6 , JM Baxi 3.1, GPPL 69)
Cashflow from operations 1800cr
Cash & cash equivalents 620cr
Receivables 400cr ( was higher in previous 2 years)